00 · Quickstart
The whole Mescla pipeline in a handful of lines. Later notebooks unpack every step; this one shows the shape of the thing.
Two methods, used together:
EMMA |
Mixing ratios |
|
|---|---|---|
Answers |
How many end-members, and which species behave as a mixture |
In what proportions they mix in each sample |
Cannot |
give you mixing ratios |
tell you whether your conceptual model is right |
Install with pip install -e ".[dev,notebooks]" from the repository root.
import matplotlib.pyplot as plt
import numpy as np

import mescla as am
from mescla.datasets import make_mixture
from mescla.plotting import plot_scree, plot_ternary, plot_uspace

print("Mescla", am.__version__)
Mescla 0.1.0
1. Some data
make_mixture generates a mixing problem and keeps the answer, which is what lets us
check the methods rather than just run them. Three end-members, five tracers, sixty
samples; the end-member analyses are noisy and the mixtures are precise — the situation
that motivates the maximum-likelihood estimator.
data = make_mixture(n_endmembers=3, n_species=5, n_samples=60, seed=0)
data
<SyntheticMixture: 60 samples, 3 end-members, 5 species. random mixture, endmember_noise=0.15, sample_noise=0.01>
2. EMMA: how many end-members?
We do not tell it the answer. Blends of n source waters spread out in n − 1 independent directions — two sources fill a line, three fill a triangle, four fill a solid — so EMMA counts the directions of real variation in the chemistry and adds one (Christophersen & Hooper, 1992). Notebook 02 does this slowly.
model = am.EMMA().fit(data.samples)
print(model.summary())
EMMA on 60 samples x 5 species (standardize=True, rule='one')
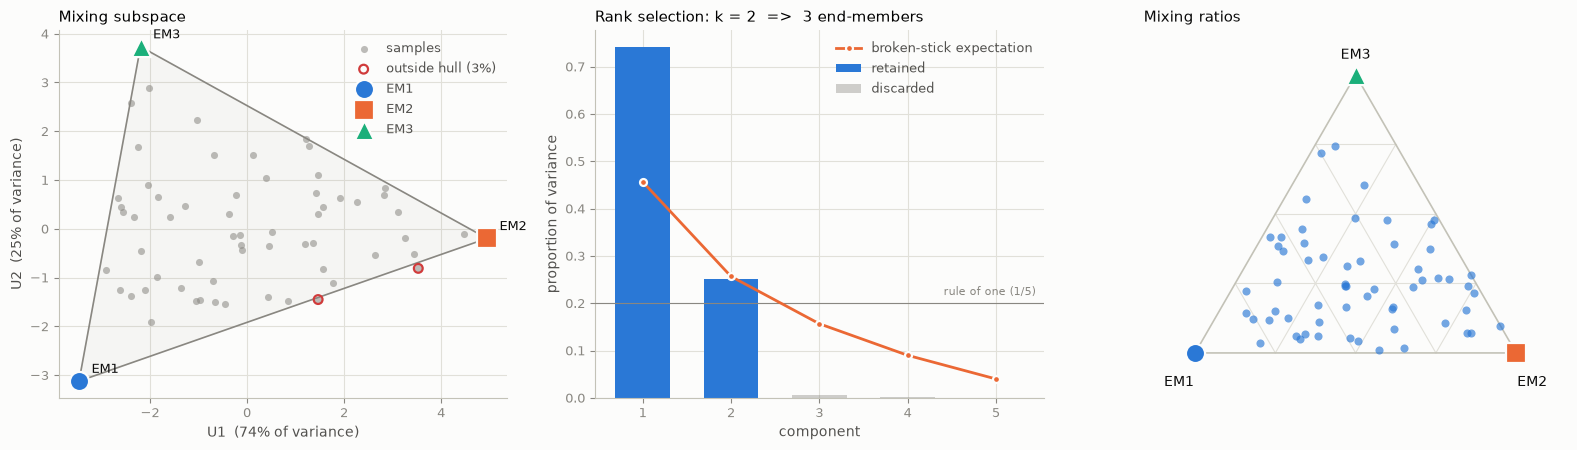
  retained k = 2 component(s), explaining 99.2% of the variance
  => 3 end-members required
  eigenvalues: [3.703e+00 1.258e+00 2.676e-02 1.186e-02 9.462e-04]
  species fitting poorly: none
Three — which is the truth. The rank_summary table shows every retention criterion side
by side, because the classical “rule of one” on its own is weak evidence.
model.rank_summary().round(3)
| eigenvalue | prop_variance | cum_variance | broken_stick_expected | rule_of_one | cumulative_variance | broken_stick | parallel_analysis | |
|---|---|---|---|---|---|---|---|---|
| EV1 | 3.703 | 0.741 | 0.741 | 0.457 | keep | keep | keep | keep |
| EV2 | 1.258 | 0.252 | 0.992 | 0.257 | keep | keep | ||
| EV3 | 0.027 | 0.005 | 0.997 | 0.157 | ||||
| EV4 | 0.012 | 0.002 | 1.000 | 0.090 | ||||
| EV5 | 0.001 | 0.000 | 1.000 | 0.040 |
3. Mixing ratios
Now that we know there are three end-members, compute the proportions. The ratios are constrained to sum to one and to stay non-negative.
result = am.mixing_ratios(data.endmembers, data.samples)
print(result)
result.ratios_frame().head()
<MixingResult (constrained least squares): 60 samples, mean EM1=37%, EM2=38%, EM3=25%>
| EM1 | EM2 | EM3 | |
|---|---|---|---|
| S001 | 0.168667 | 0.725047 | 0.106286 |
| S002 | 0.117581 | 0.812084 | 0.070335 |
| S003 | 0.081473 | 0.544412 | 0.374114 |
| S004 | 0.710182 | 0.172835 | 0.116983 |
| S005 | 0.490966 | 0.454008 | 0.055026 |
4. Did it work?
We have the truth here, so we can check honestly.
error = np.abs(result.ratios - data.true_ratios)
print(f"mean absolute error in the mixing ratios: {error.mean():.4f}")
print(f"worst single sample:                      {error.max():.4f}")
mean absolute error in the mixing ratios: 0.0348
worst single sample:                      0.1240
5. Look at it
Two figures carry most of the interpretation: the mixing diagram (do the end-members bound the samples?) and the scree plot (how solid is the rank?).
fig, axes = plt.subplots(1, 3, figsize=(16, 4.6))
plot_uspace(model, data.true_endmembers, ax=axes[0])
plot_scree(model, ax=axes[1])
plot_ternary(result, ax=axes[2])
fig.tight_layout()
Use this in your own code
Self-contained: swap the CSV path for your own file and go.
import pandas as pd
import mescla as am

samples = am.WaterChemistry.from_frame(
    pd.read_csv("my_samples.csv", index_col=0)      # samples x species, mg/L
)
endmembers = am.EndMembers.from_frame(
    pd.read_csv("my_endmembers.csv", index_col=0)   # end-members x species, same columns
)

model = am.EMMA().fit(samples)
print(model.summary())                  # how many end-members the data require
print(model.hull_fraction(endmembers))  # do yours bound the samples?

result = am.mixing_ratios(endmembers, samples, sigma=0.05 * samples.data)
result.ratios_frame().to_csv("mixing_ratios.csv")
Next: 01_data_and_qaqc.ipynb — real data, and the checks to run before any of this.